MERFISH (multiplexed error-robust fluorescence in situ hybridization) images individual RNA molecules right where they sit in tissue. Hundreds of genes per cell, positions kept — so the anatomy comes from the molecules themselves.
Portfolio repo, not a production pipeline: notebooks and pytest walk a Vizgen coronal cohort through QC, clustering, cell-type mapping, and CCF registration. Synthetic fixtures run offline in CI; live tests hit public downloads when you have network.
Every gene gets an error-correcting binary code.
MERFISH reads each gene as a binary codeword spread across many imaging rounds — the on/off pattern names the gene. The code self-corrects (16-bit, Hamming-distance-4), so one misread round can't change the answer. That's the "ER" in MERFISH.
Six stages, one AnnData object.
Segmentation comes first — it decides what counts as a cell — then QC, clustering, mapping, and atlas registration hand off through the same object.
- IngestMERSCOPE mosaics, transcripts, cell-by-gene, boundaries
- Segmenttranscript-aware re-assignment (upstream of counts)
- QCvs bulk RNAseq + replicate correlation
- ClusterScanpy PCA · UMAP · Leiden
- Cell typesmarker correlation + bootstrap confidence
- Register2D section → Allen CCFv3, per-cell region
QC before clustering.
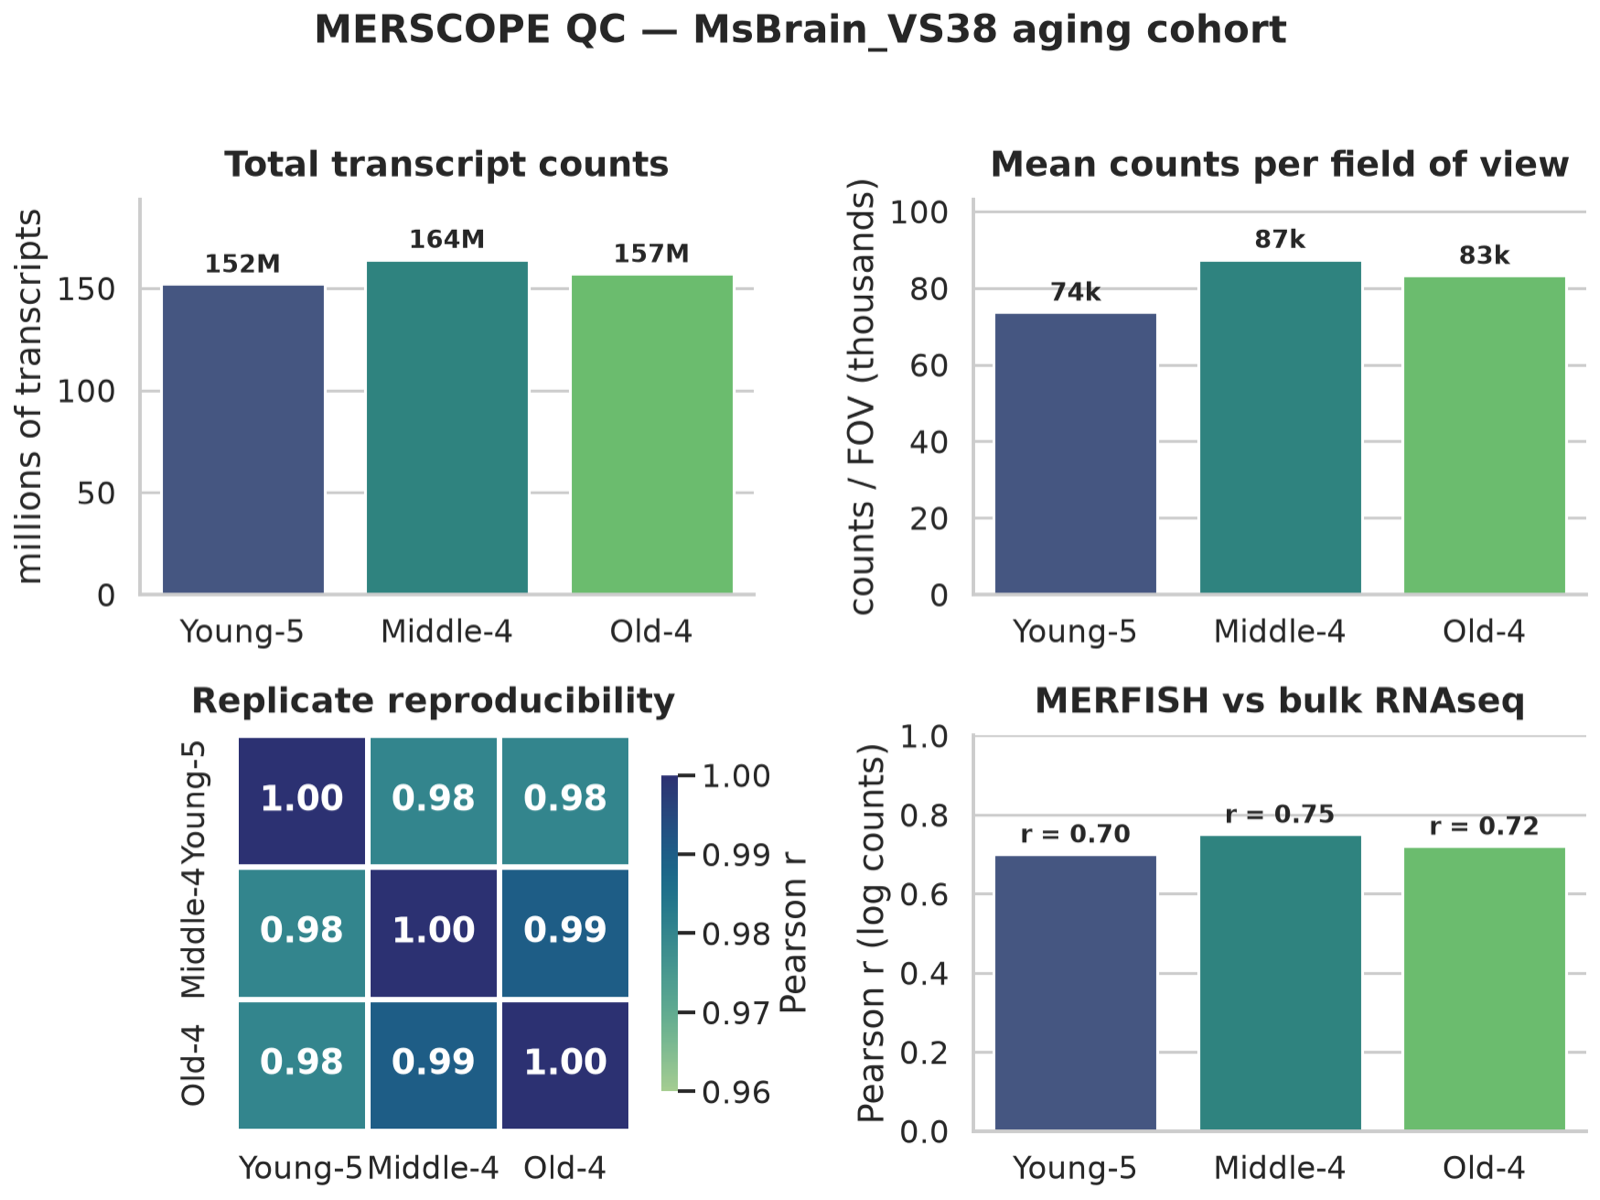
MERFISH counts should match bulk RNAseq and reproduce across replicates in the MsBrain_VS38 aging cohort — rendered with seaborn from cohort data.
Cell types with a confidence score.
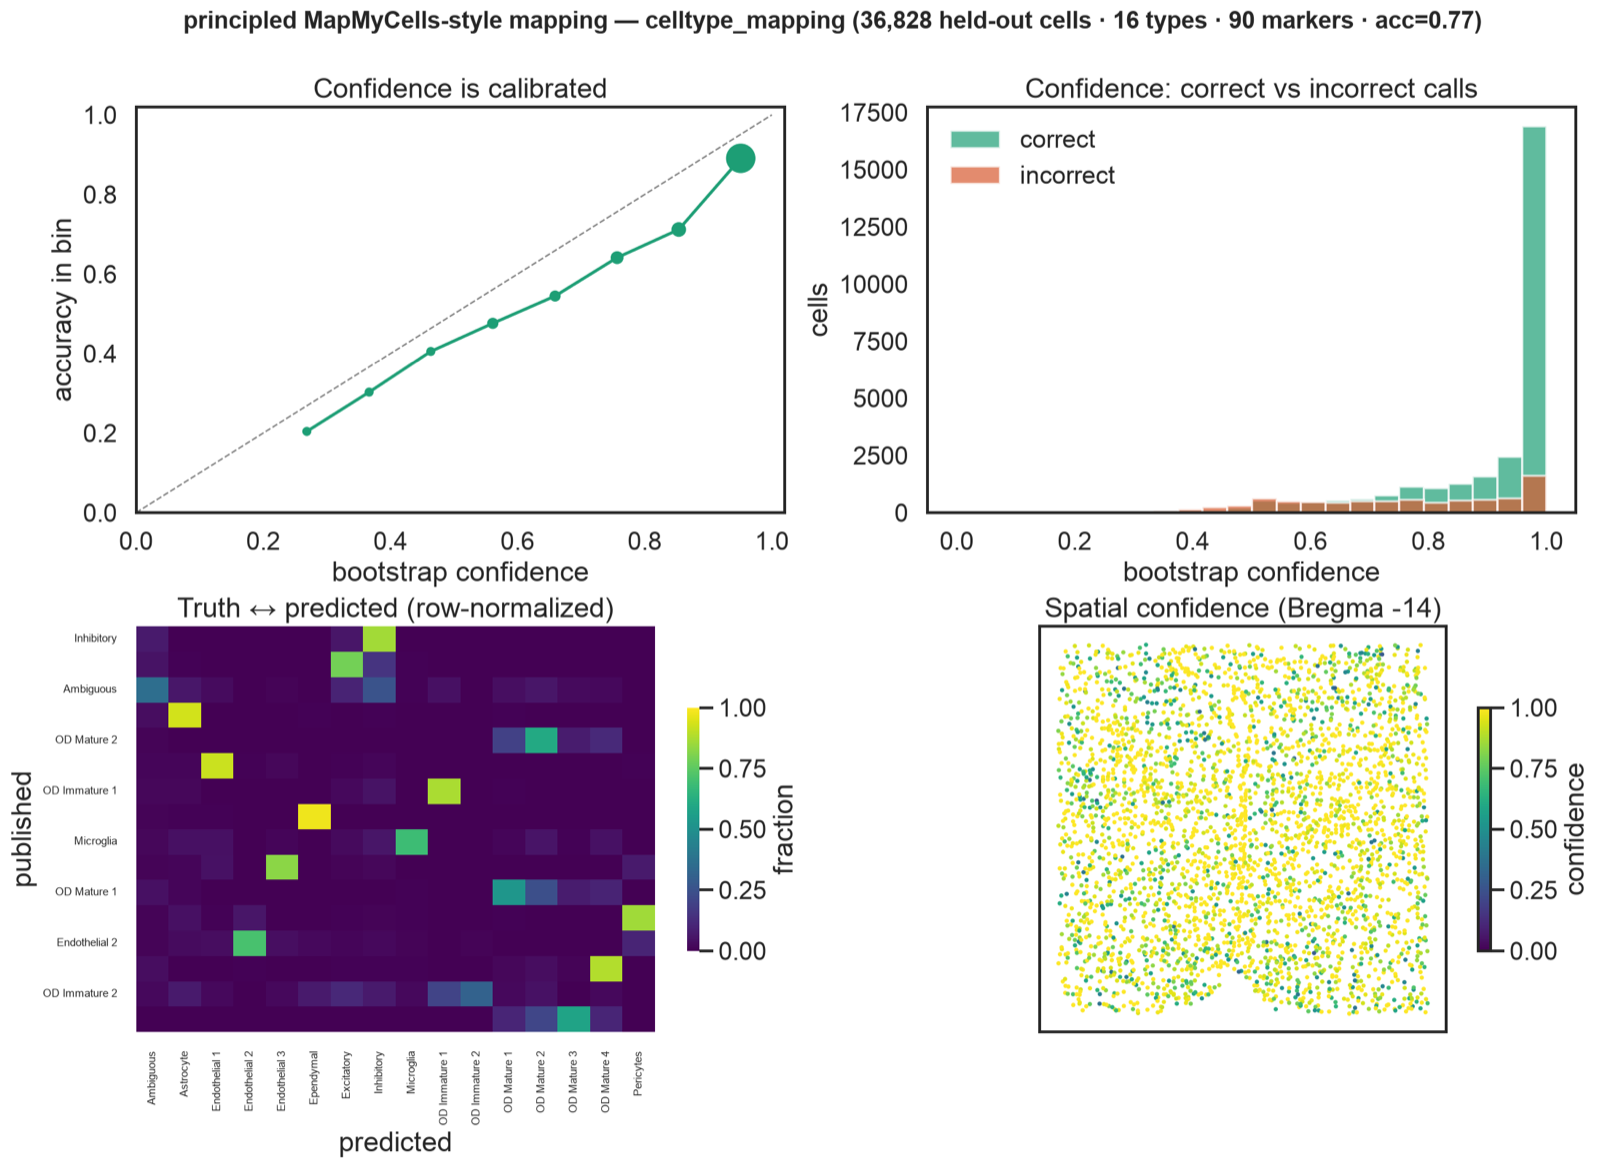
I reimplemented the Allen cell_type_mapper approach on Moffitt 2018 hypothalamus hold-out data: marker-gene matching plus a bootstrap confidence that beats the old cosine heuristic (label only, no score). Fine subtype accuracy within correct classes: 0.82.
Segmentation sits upstream.
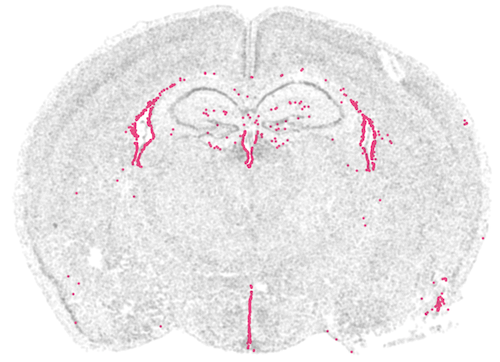
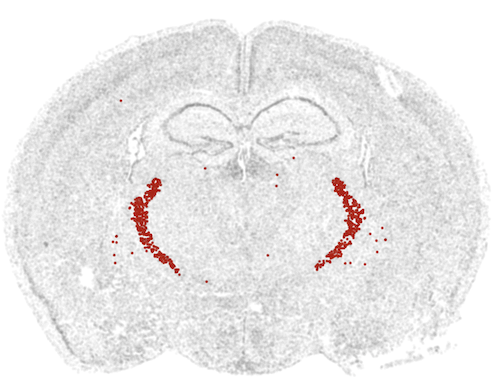
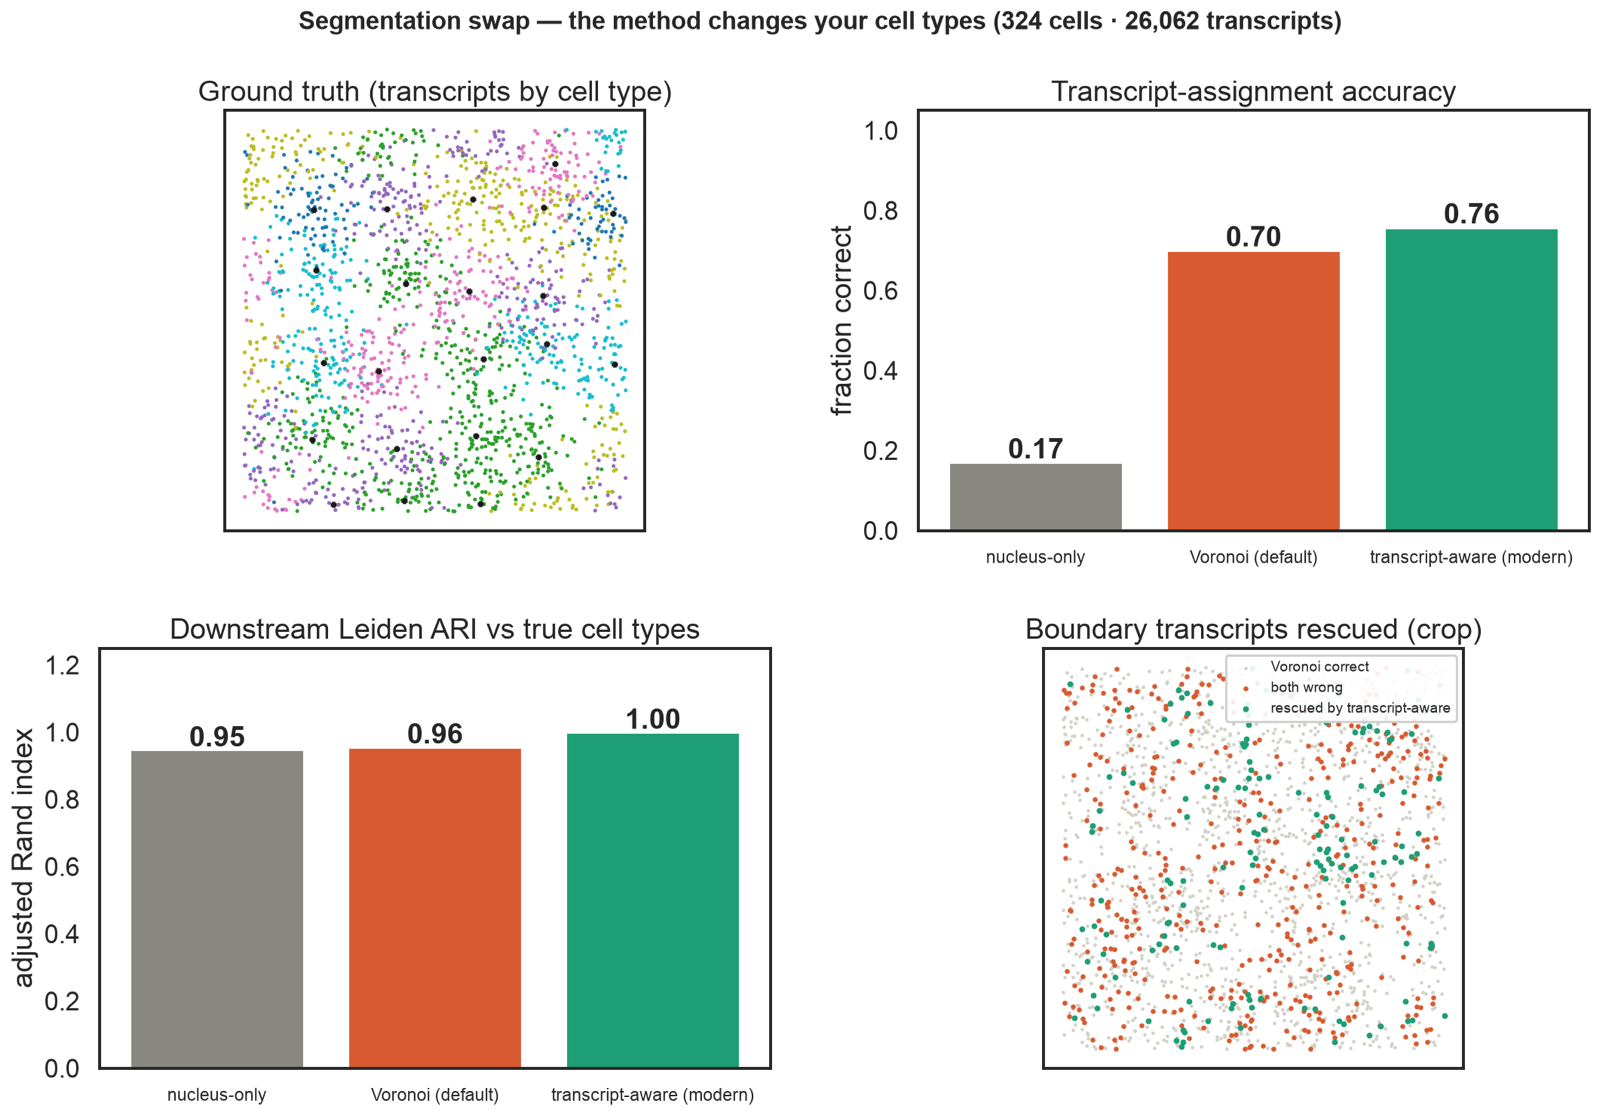
Draw the cell boundary wrong and everything downstream shifts. On shared ground truth, transcript-aware assignment hits 0.76 accuracy (Voronoi 0.70, nucleus-only 0.17); downstream Leiden ARI reaches 1.00 vs 0.96 baseline. Three methods benchmarked end-to-end (Baysor / proseg / segger-style).
Register the section to CCFv3.
Each cell needs a brain-region label — anchor the AP plane, warp with STalign, lift labels from the Allen atlas. The registration core adds per-cell confidence and a QC score that separates good fits from deliberately bad ones (0.14→0.96 on synthetic misalignment). High-confidence calls hit ~98–99% at every ontology depth on that synthetic geometry; 670 leaf regions roll up the ontology tree.
STalign LDDMM, ground-truthed
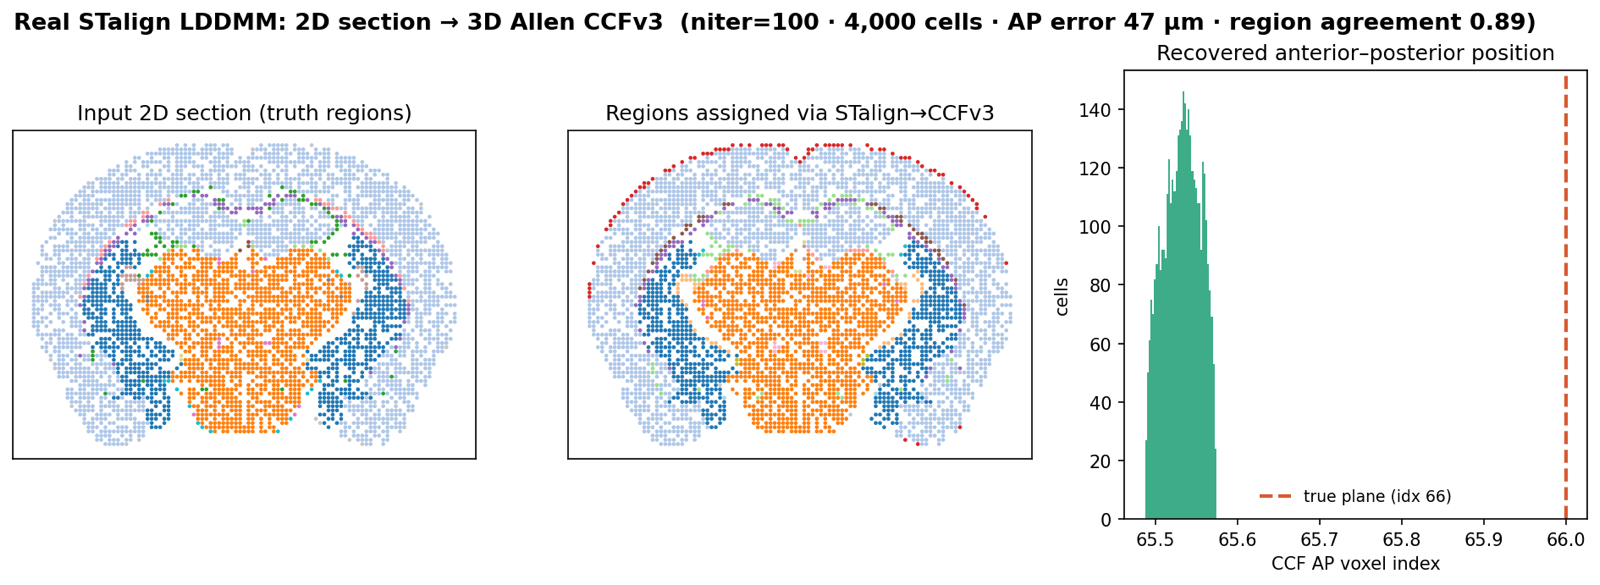
On a slice cut from a known plane, STalign places it to 46.7 µm — under half a voxel — and gets 0.89 of per-cell labels right, in about two minutes on CPU. A real 2D→3D fit, not a stub.
Auto AP-anchor for STalign's init-sensitivity
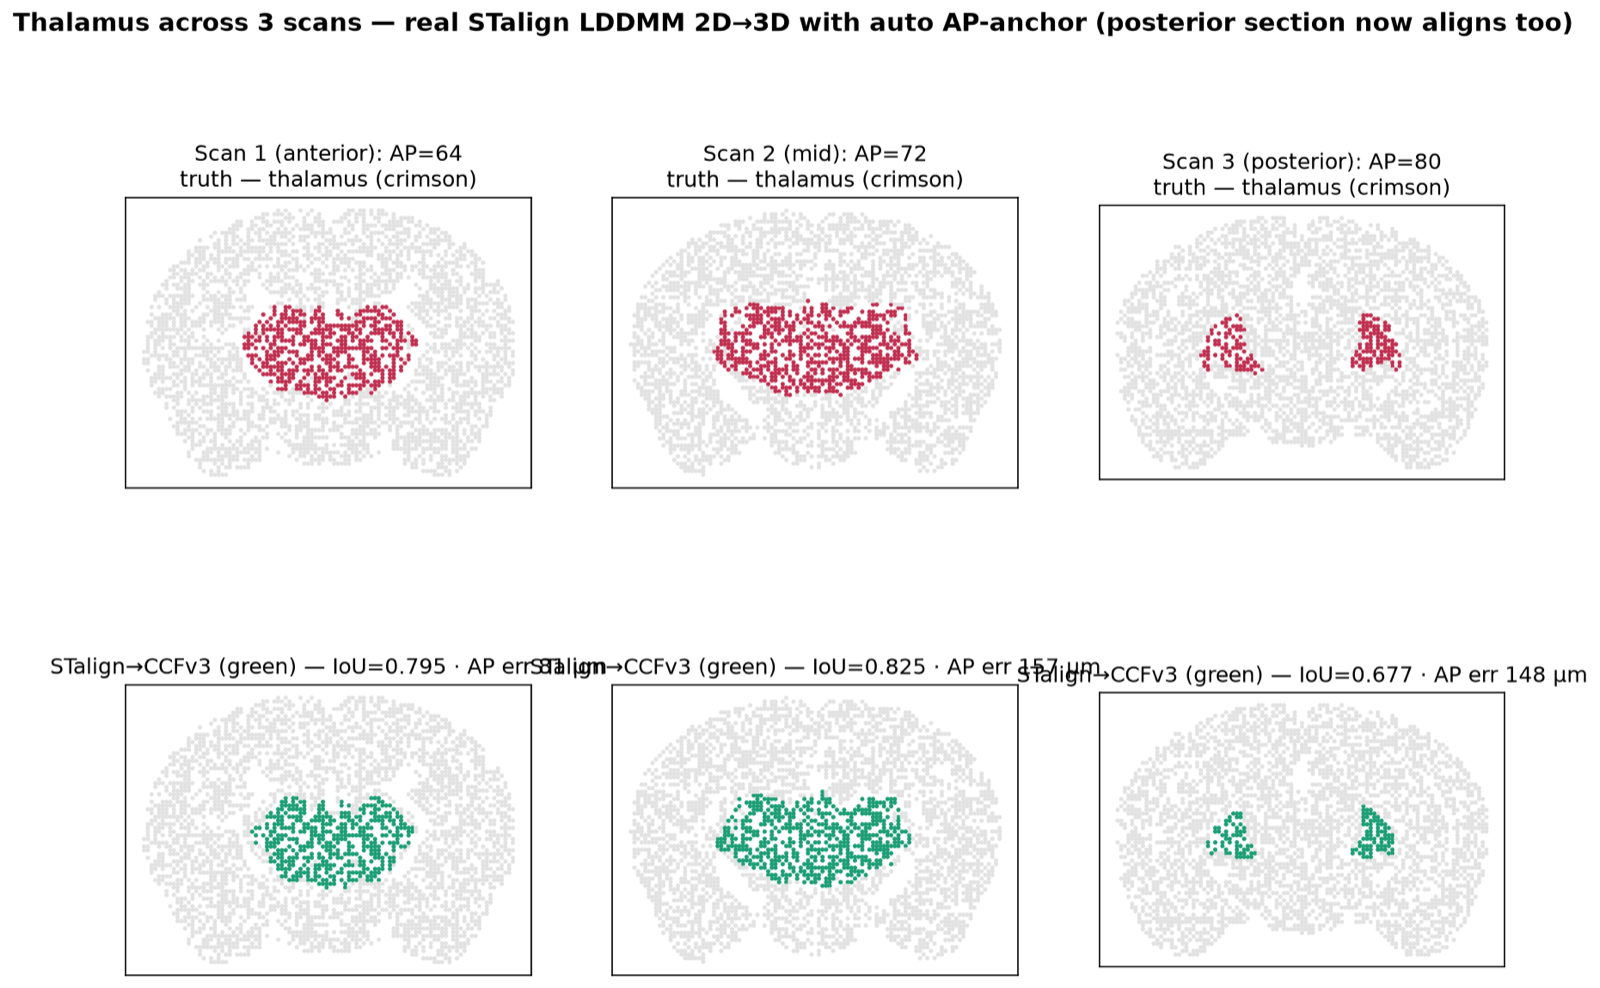
STalign can misfire on its starting guess — a posterior slice landed 1.44 mm off before the anchor. Sliding the section against every atlas plane fixes depth first: posterior AP error drops 1440→148 µm, thalamus IoU on that scan goes 0.23→0.68, and all three thalamic test sections align (was 1/3). Anchor logic is unit-tested; posterior recovery is live-tested.
Live test on Moffitt 2018.
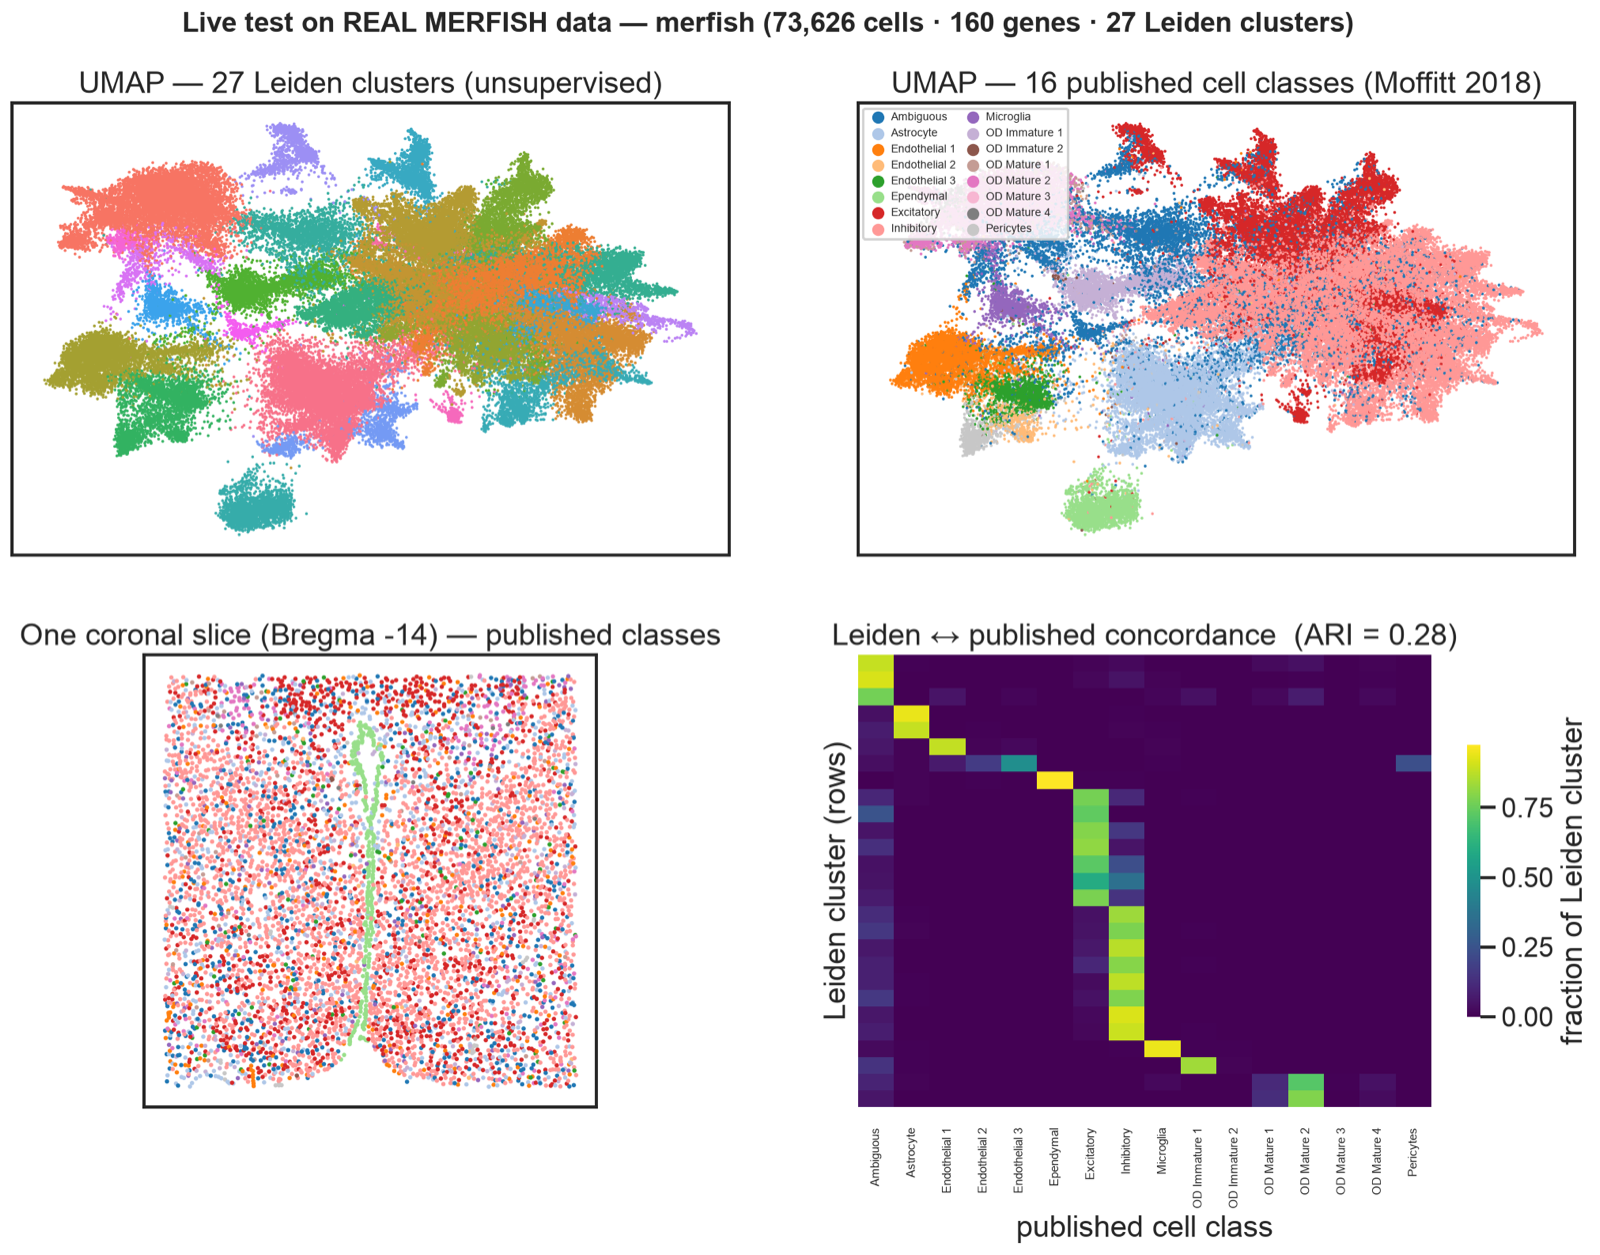
Moffitt et al. hypothalamic MERFISH — 73,626 cells, 160 genes. Unsupervised Leiden (27 clusters) vs 16 published classes: ARI 0.28 (random ≈ 0), concordant UMAP, real coronal anatomy.
Imaging vs sequencing.
MERFISH is one of three imaging platforms that read single molecules in place. Imaging trades panel size for subcellular precision; sequencing trades precision for whole-transcriptome reach.
| Platform | Chemistry | Max panel | Resolution |
|---|---|---|---|
| Vizgen MERSCOPEthis project | MERFISH — iterative smFISH barcoding | ~1,000 genes | 100 nm pixel |
| 10x XeniumPrime 5K | Padlock-probe ligation + RCA | ~5,000 genes | XY <30 nm |
| Bruker CosMxWTX | Cyclic FISH, no RT/PCR | ~19,000 genes | ≤100 nm FOV-scale |
The field is standardizing on SpatialData, segmentation is the active research front, and panels keep growing toward whole-transcriptome imaging.
Repo status.
Light core in CI; heavy atlases and engines plug in behind the same interface.
- implementedScanpy pipeline, cell-type mapper, segmentation benchmark, and the registration core (geometry, label transfer, uncertainty, QC), all covered by offline pytest.
- validatedAllen CCFv3 via brainglobe, and the STalign LDDMM deformable backend with a ground-truthed fit, in an isolated NumPy-2 / Python-3.12 environment.
- wired-inDeepSlice, ANTs, and the Allen
cell_type_mapperare stubbed behind the live interfaces with install hints. They need large downloads, not new architecture.
Honest caveat (also in the repo): the calibration and QC numbers use a synthetic registration error on real atlas geometry — so they test the math, not an engine's end-to-end accuracy. The STalign result is a real fit.
A few choices.
Cell-type and region calls both ship calibrated confidence — same pattern, two stages. Every stage has a no-download synthetic path so pytest runs in CI without atlas downloads; real engines slot in behind the same function signatures. STalign upstream still pins numpy==1.23; I install it --no-deps beside NumPy 2.4 in one venv rather than maintaining a separate STalign-only environment.